No time to read now? How about listening to the article? Try it out in the player below!
The adoption of the Power Platform grows each month, the appetite for Citizen Development is growing in the Companies, and the app makers don’t stop having new ideas and create new apps every day to solve business cases.
With the explosion of the Power Platform, the companies are creating and empowering their app makers to develop even more. All this power is fantastic to accelerate the organizations’ digital transformations, but some new concerns also appear to the security and governance teams. The questions these teams need to have an answer (I plan to answer these questions throughout the articles):
- How many App Makers does the organization have?
- How many Apps and Cloud flows does the organization have?
- What do these Apps and Flows do?
- Where is the source code?
- What data are being used?
- How will be deployed on production and what objects will be created?
The questions above are only of the many questions that should answer. To help the companies to address this concern, Microsoft created the Power Platform Center of Excellence (CoE) Starter kit. It is a collection of components and tools designed to help you get started with developing a strategy for adopting and supporting Microsoft Power Platform, focusing on Power Apps, Power Automate, and Power Virtual Agents.
It’s a free CoE Starter kit provided by Microsoft, and you can download it using the link available at the end of the article.
Keep in mind the CoE is a starter kit, not a complete solution kit. You may need to make some changes for your organization.
I’ll split this subject into four articles:
- Overview: Define goals and expected outcomes of your CoE
- Admin: Gain insights into your Microsoft Power Platform adoption
- Govern: Establish audit and compliance processes
- Nurture: Accelerate your adoption by thriving with a community of makers
Overview
According to Microsoft, we have the following definition of this kit:
“The kit provides some automation and tooling to help teams build monitoring and automation necessary to support a CoE. The foundation of the kit is a Microsoft Dataverse data model and workflows to collect resource information across the environments in the tenant. The kit includes multiple apps and Power BI analytics to view and interact with the data you collect, in addition to flows to collect data across environments and help with workflows for your compliance needs. The kit also provides several templates and suggested patterns and practices for implementing CoE efforts.“
This kit is composed of the following main components:
- Dashboards: provides an overall of all the created Power Platform components of the organization.
- Power Apps Canvas App: a set of Apps to help the Makers and Admins manage the existing components or request to create new ones.
- Power Automate Flows: responsible for executing the automation process on the organization. These flows can create environments, request approvals, and collect all regarding the use of the components and environments.
- Power Apps Model-Driven: provides a real-time view of the components (Apps, Flows, Makers, etc) of the organization where you can add additional details if needed.
All these components will provide you tools and data, giving you all the visibility of what’s happening on your tenant so that you can take actions and decisions based on correct information.
Let’s go through some dashboards to show you what views you’ll have once the kit is installed and configured.
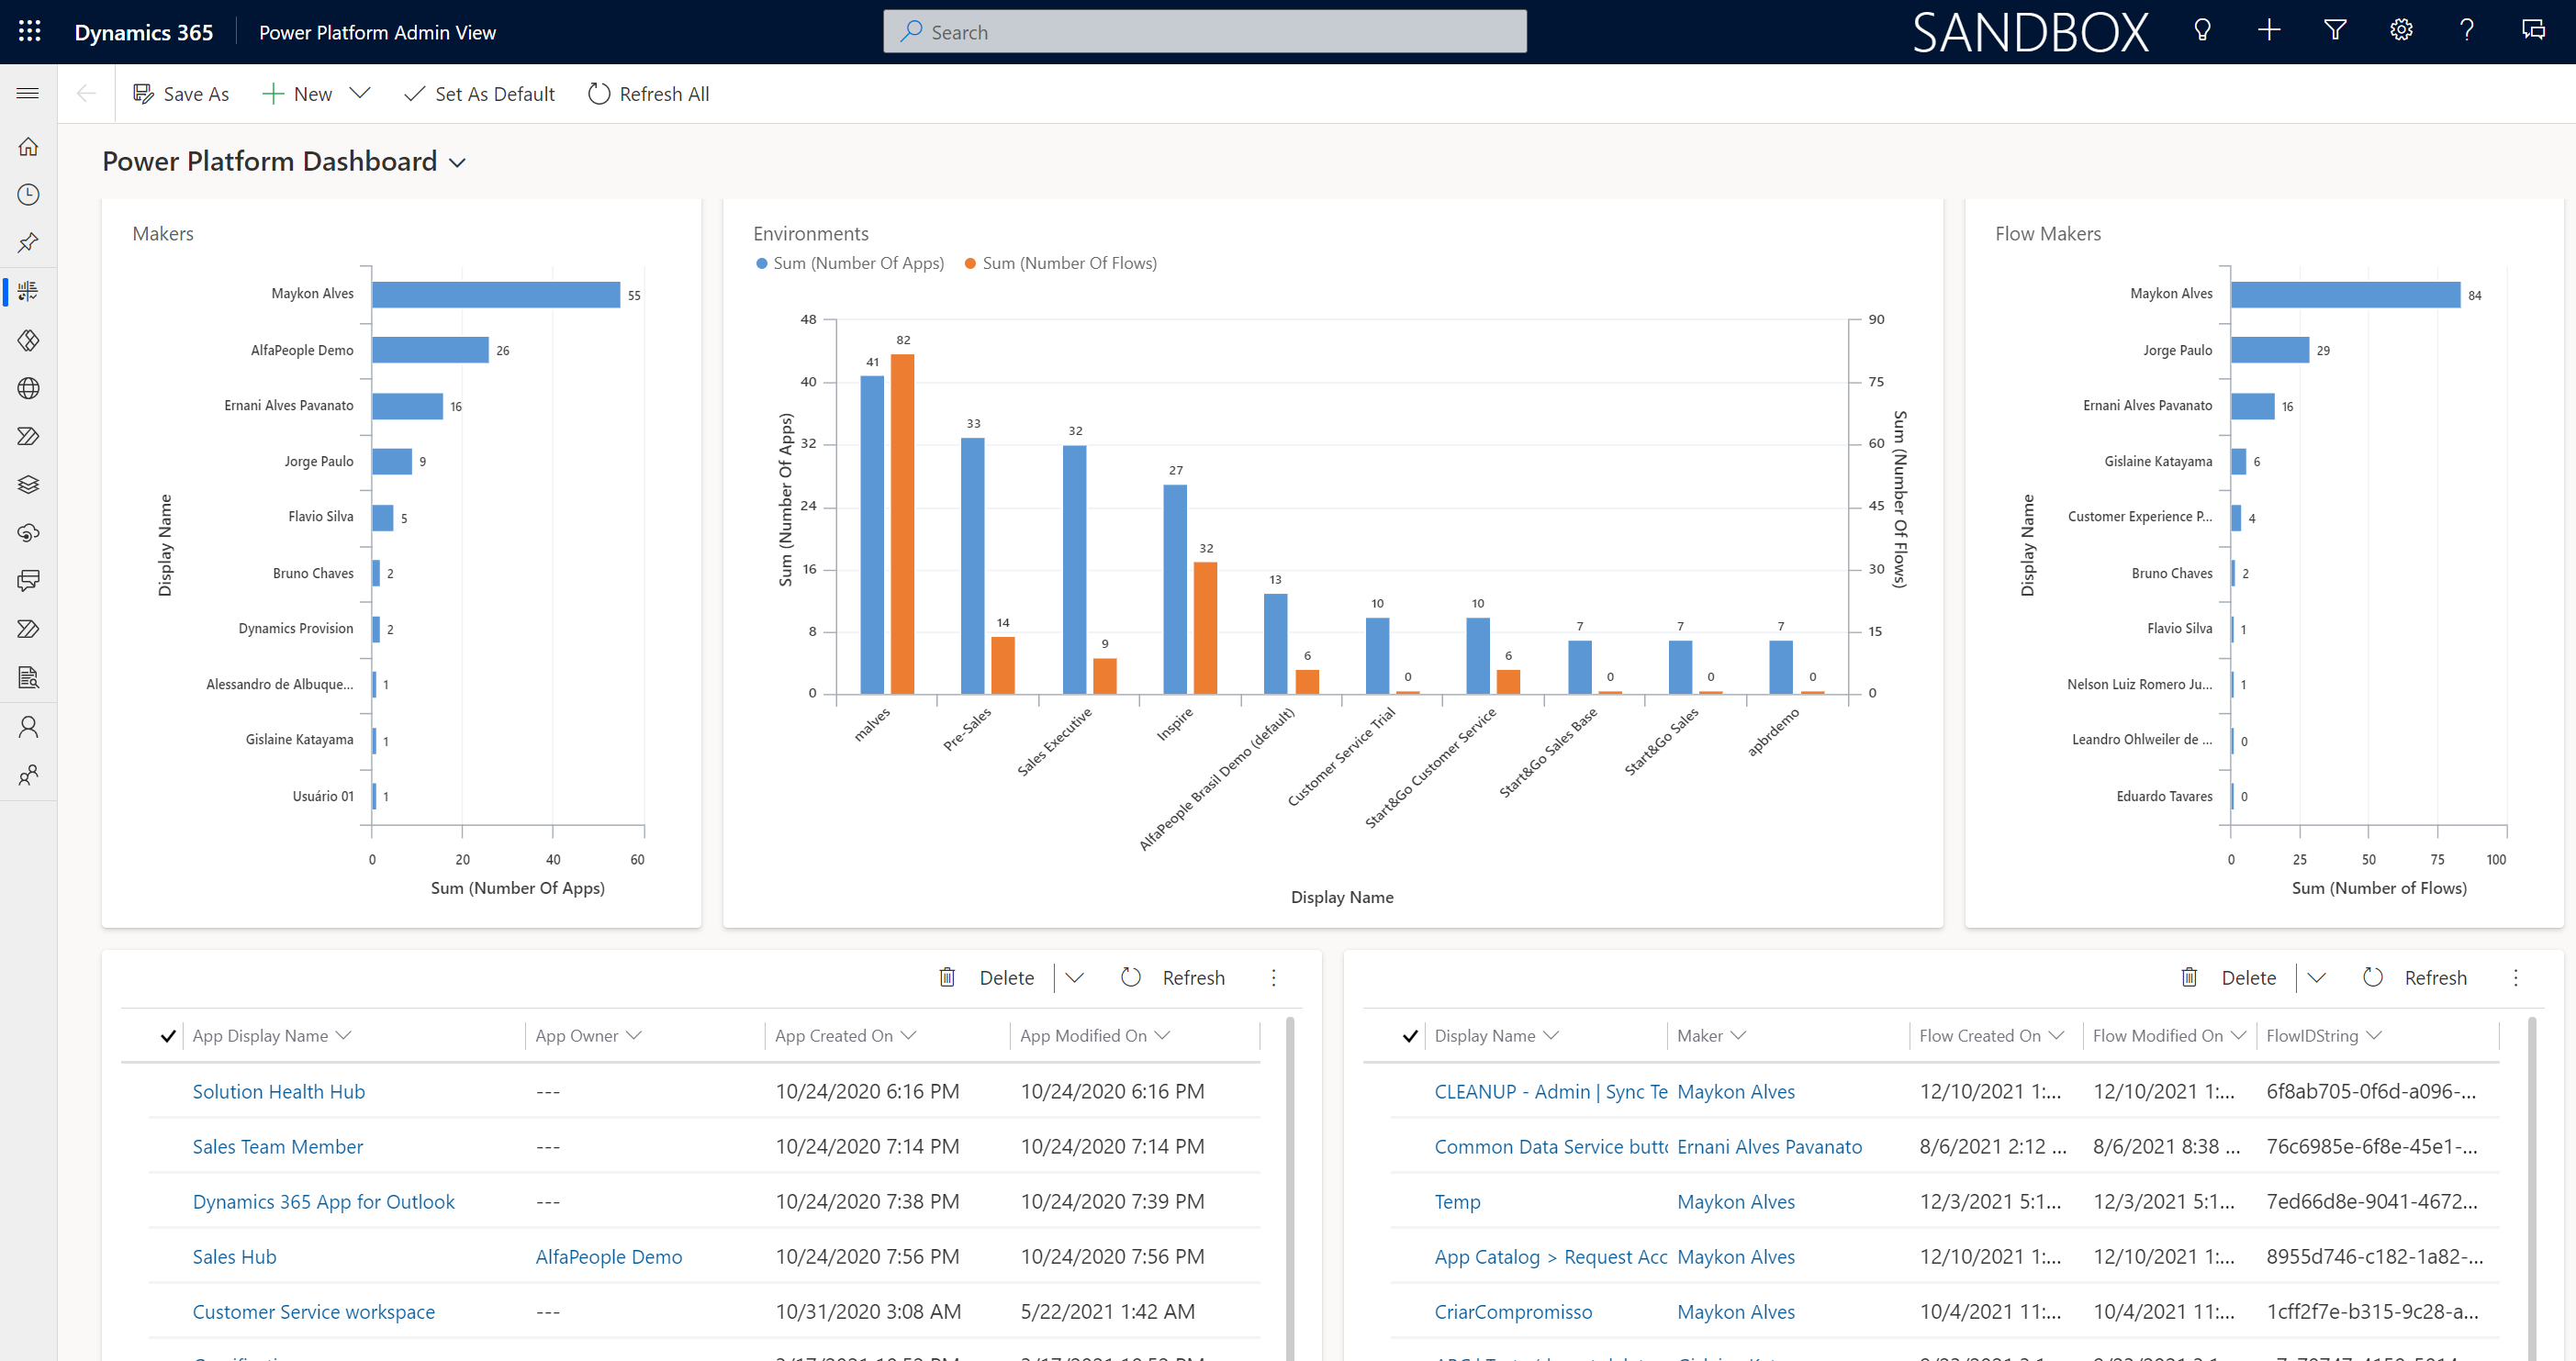
Power Platform Admin View
On this dashboard, you’ll have a quick overview of the Active App, Environments, Flows Makers. Also, you may list Portal, Connectors, Chatbots, and Audit Logs.
For you to open the dashboard, you just need:
- Navigate to make.powerapps.com
- Select the organization that you’ve installed the Coe Kit
- Nagivate to App menu
- Open the Power Platform Admin View
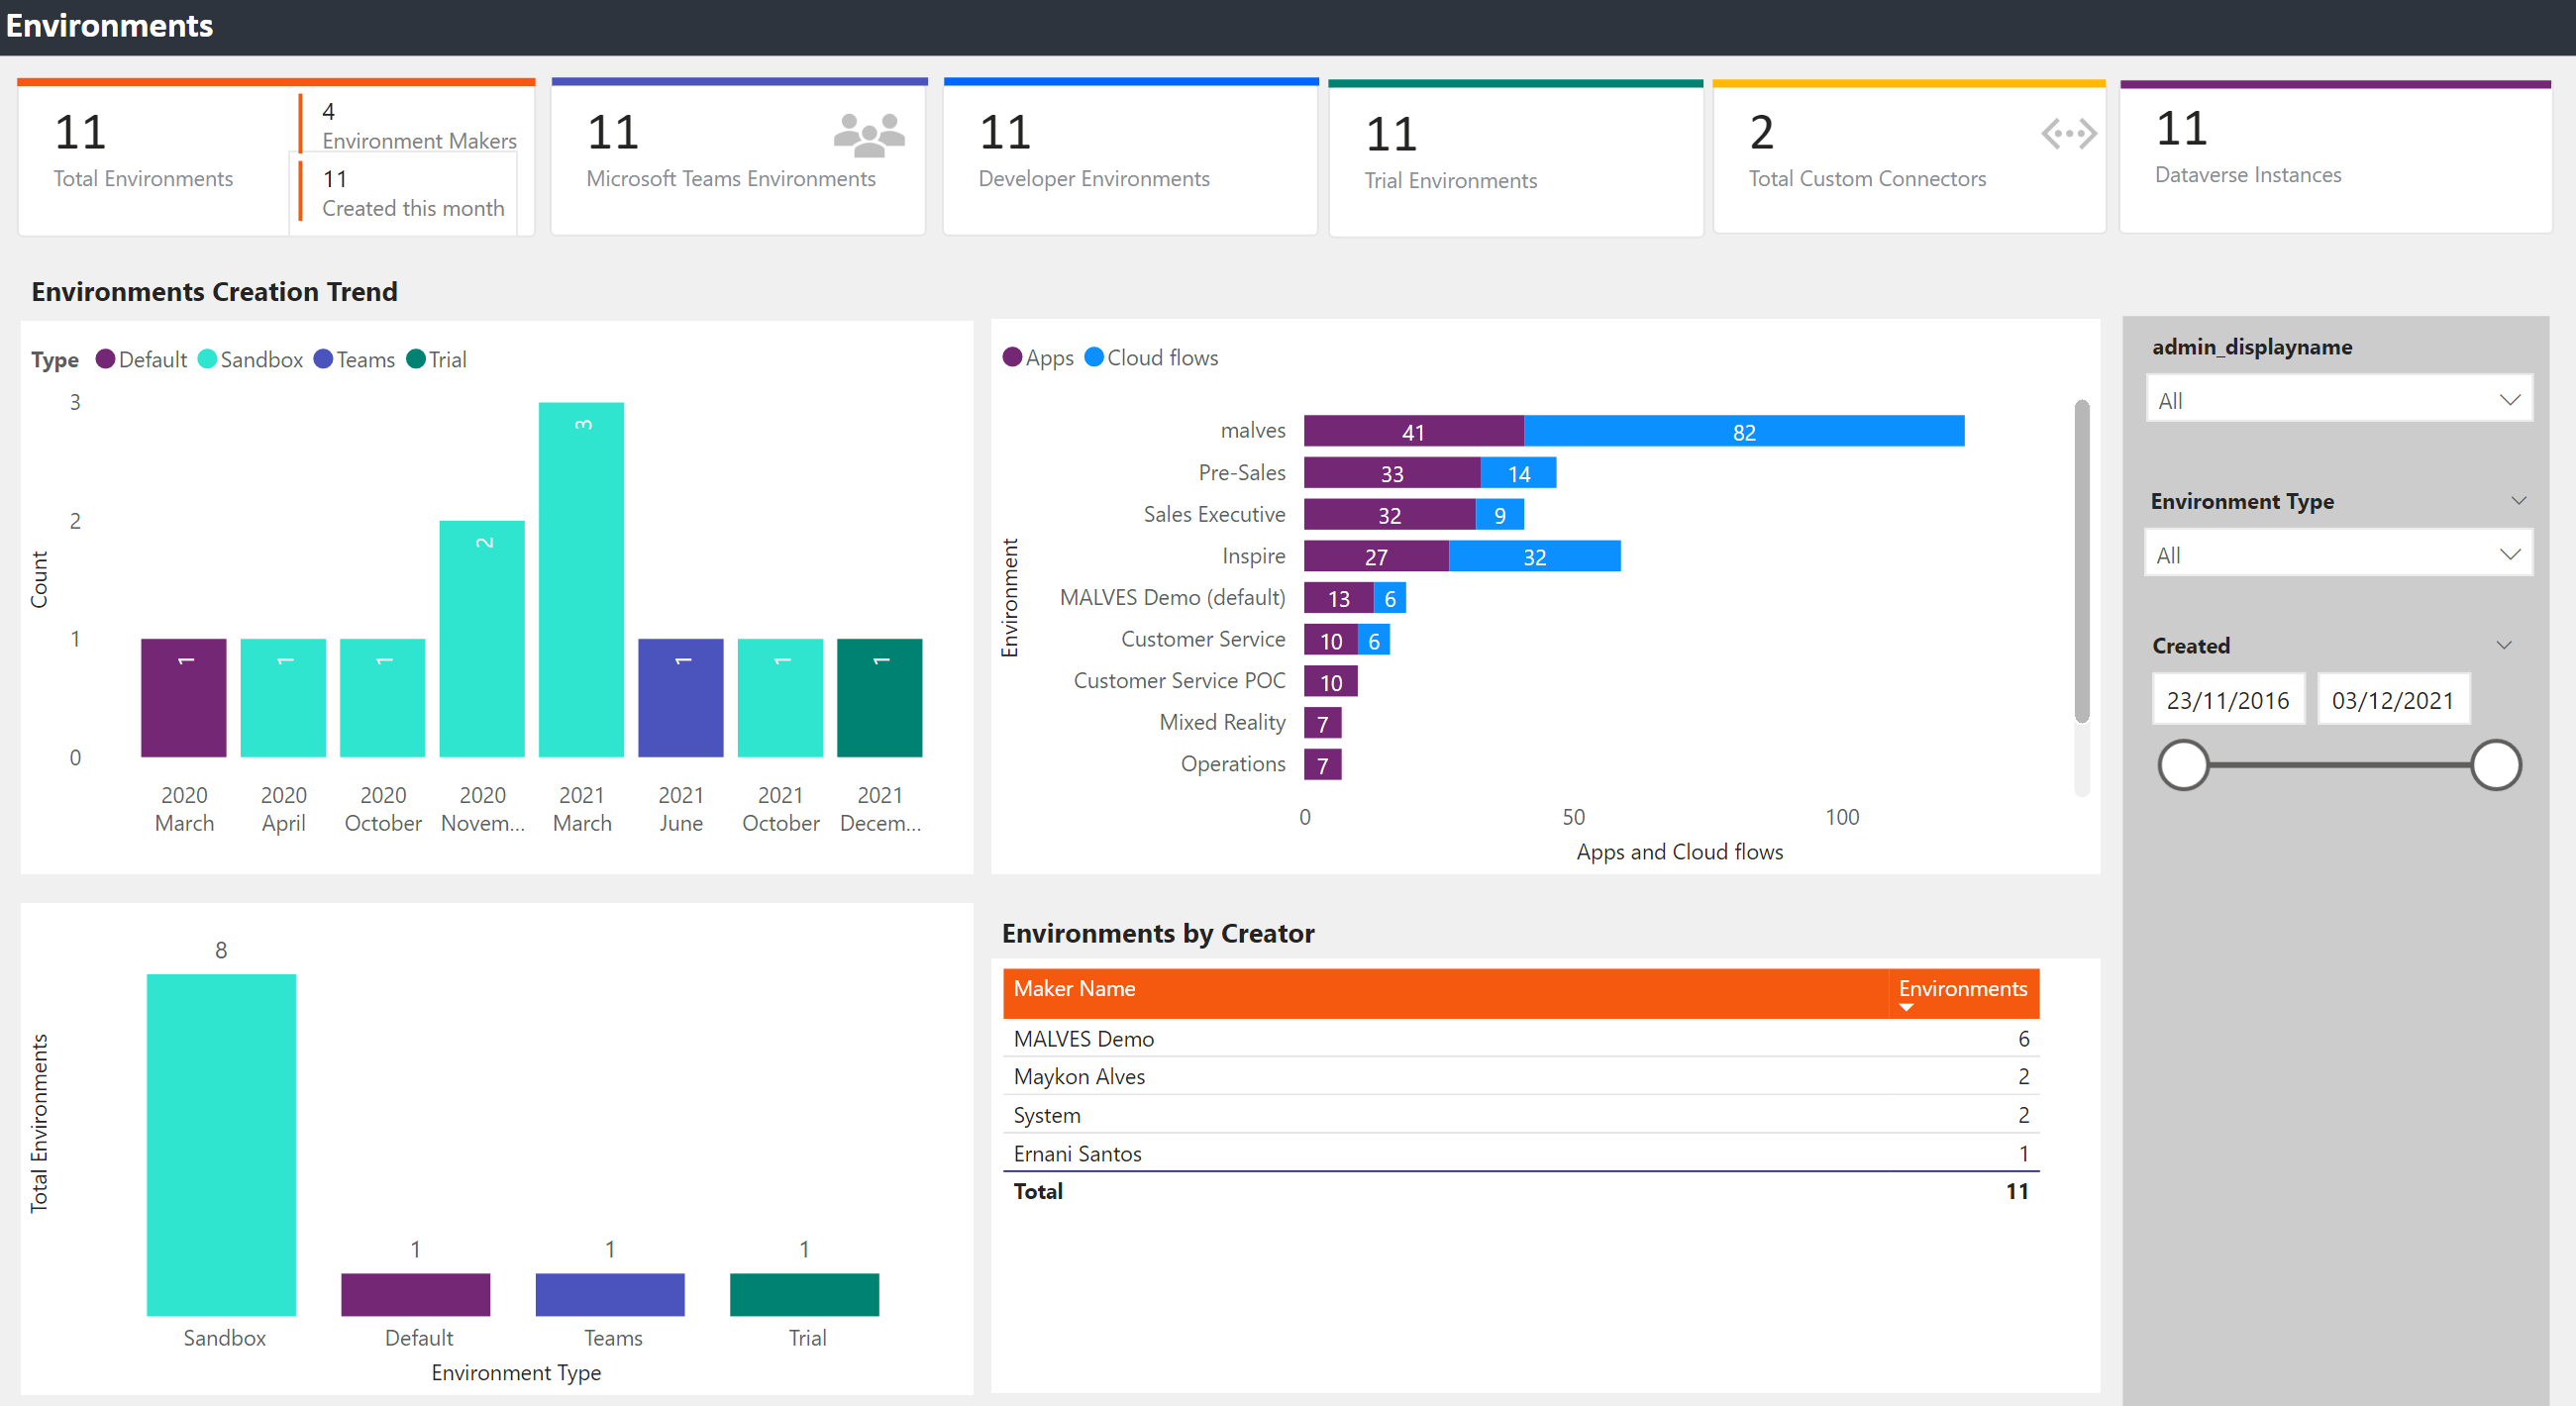
Environments
From here, you’ll need to install the Power BI and download the file from the CoE Starter kit package. Once opened the Power BI file, you’ll have all the views that I’ll describe during the article.
In the Environment section, we have an overall of the environments created and their types. Besides, you view the Apps and Cloud Flows created in each environment. Here the CoE kit starts to cover some of the questions described at the beginning of the article. 🙂
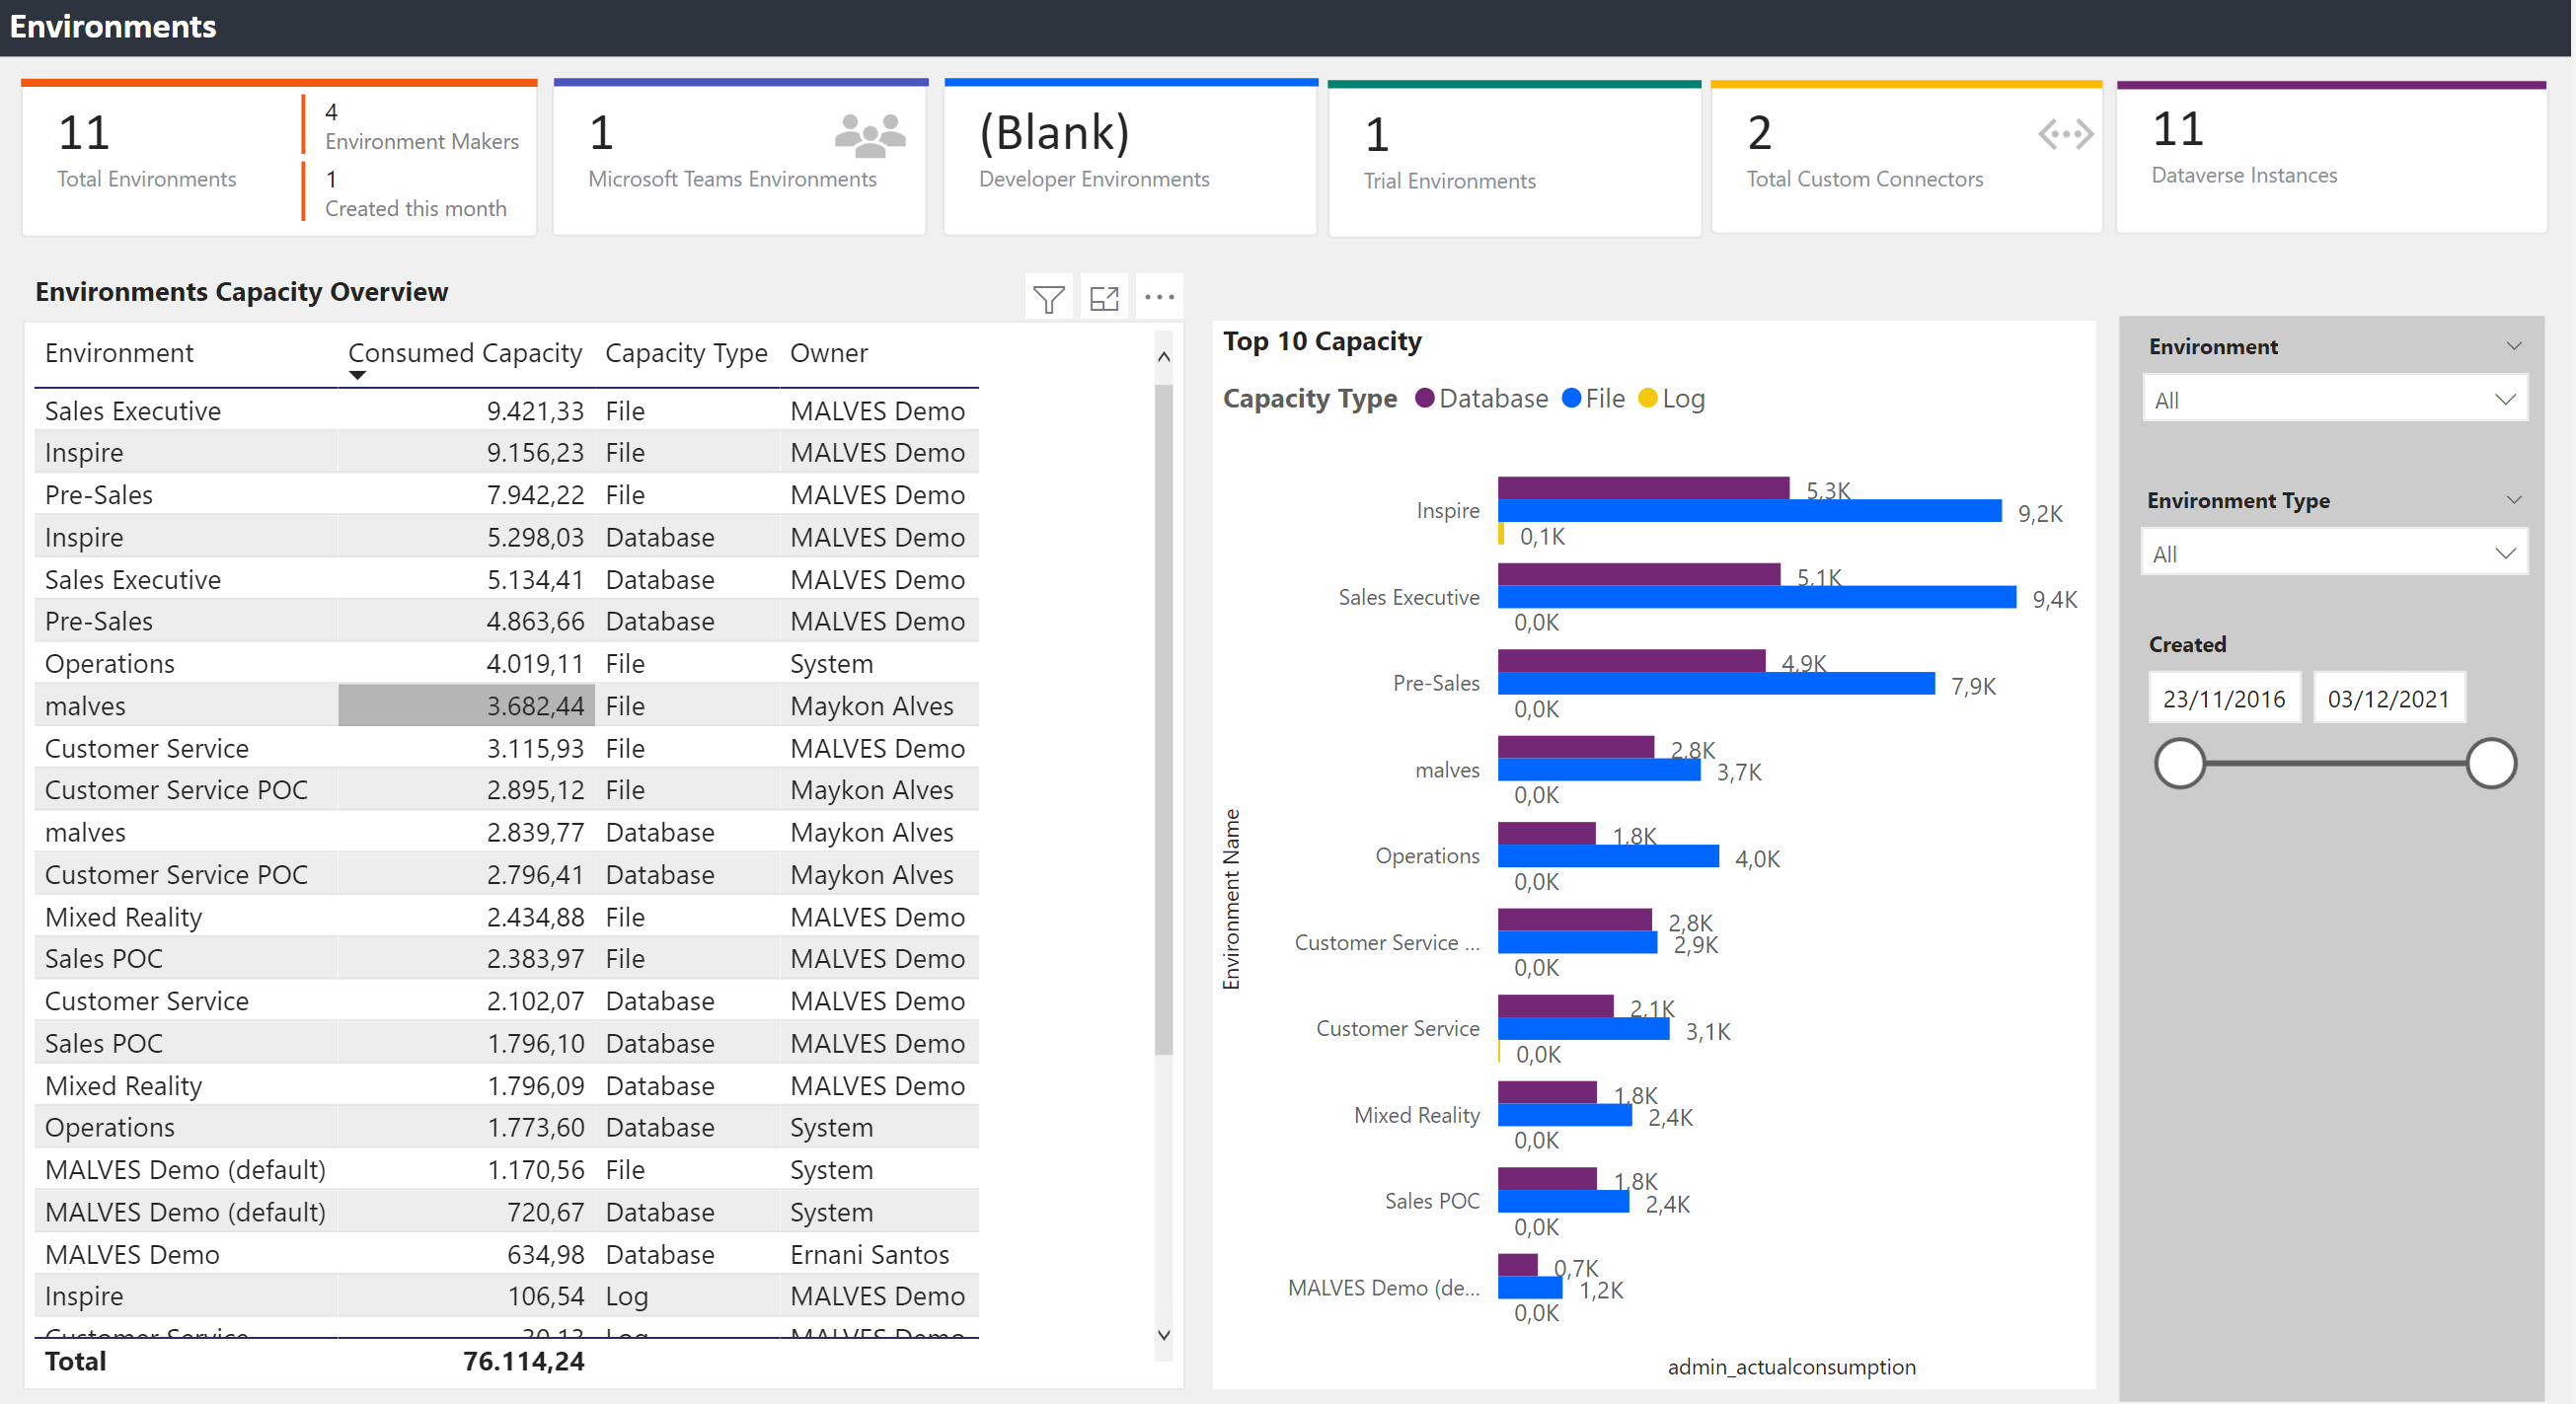
Also, the dashboards provide you with the Environment capacity overview and the environments that consume more space on the tenant.
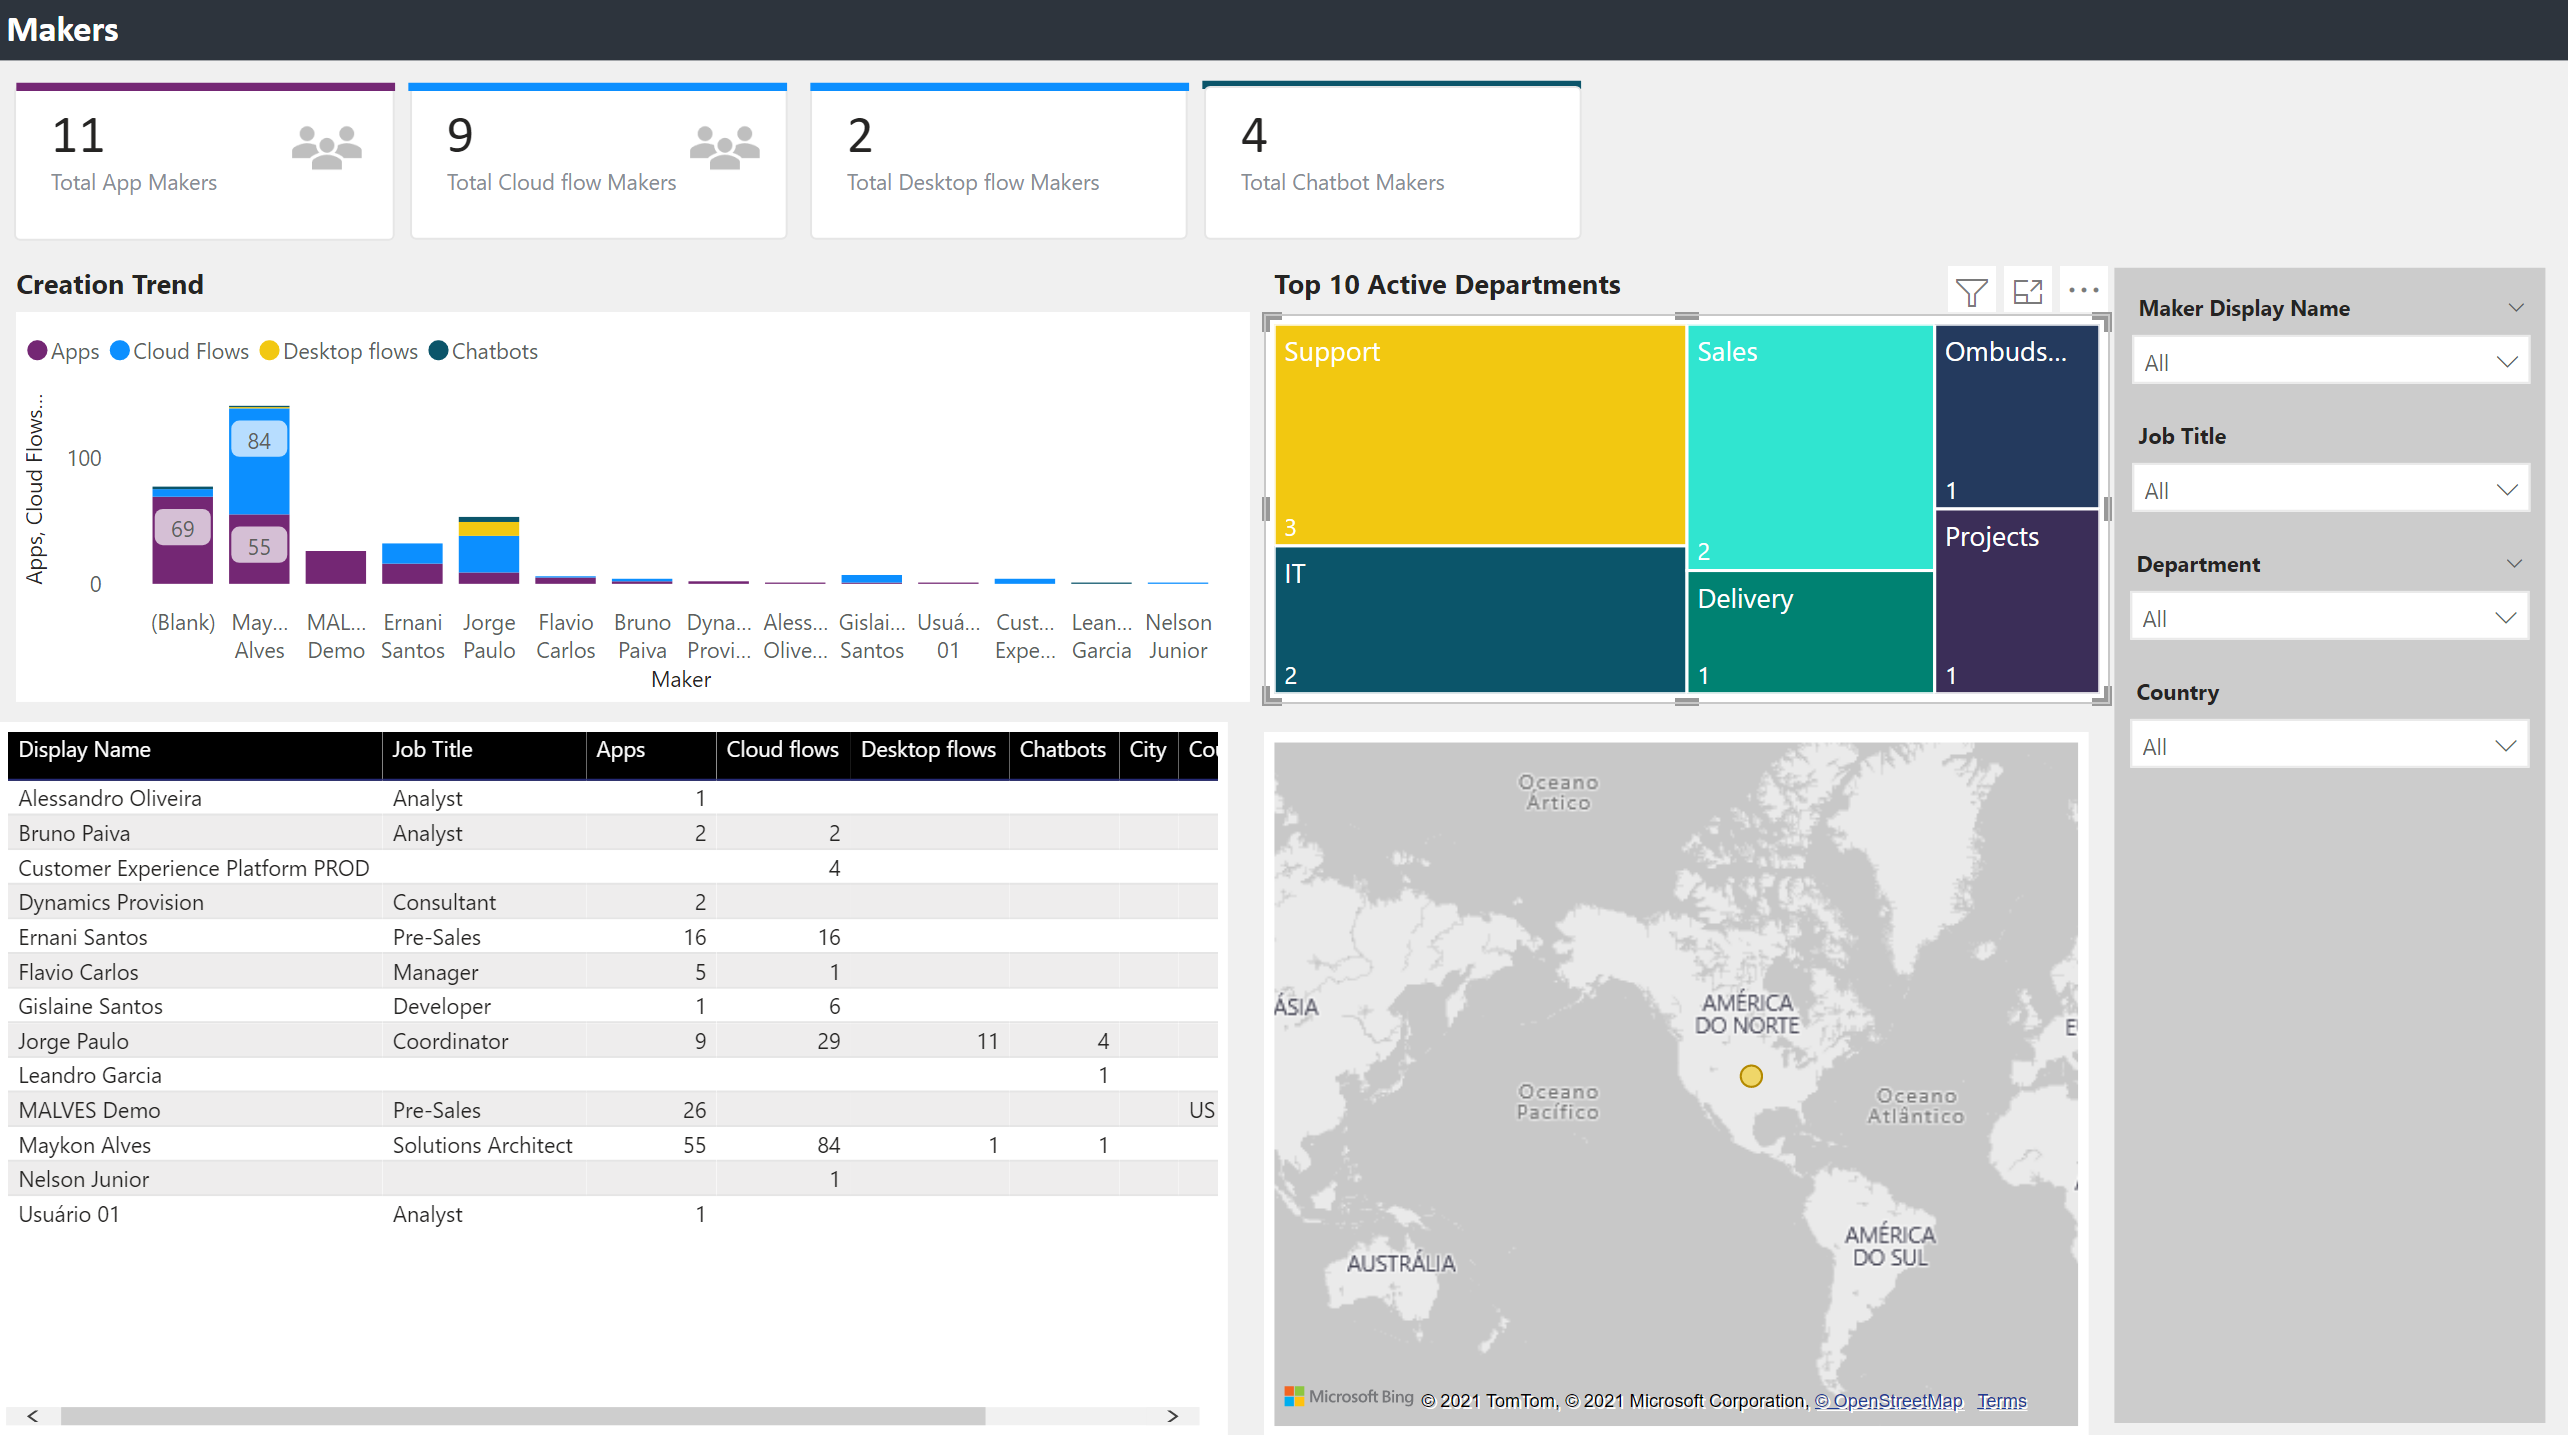
Makers
Do you remember one of our questions? “How many App Makers do the organization have?”. The section Makers gives the answer! Besides that, you have how many Apps, Cloud Flows, Desktop Flows, and ChatBots by Makers and departments. Based on this view, you may even nominate the maker as Power Makers according to the quantity of the component they’ve created.
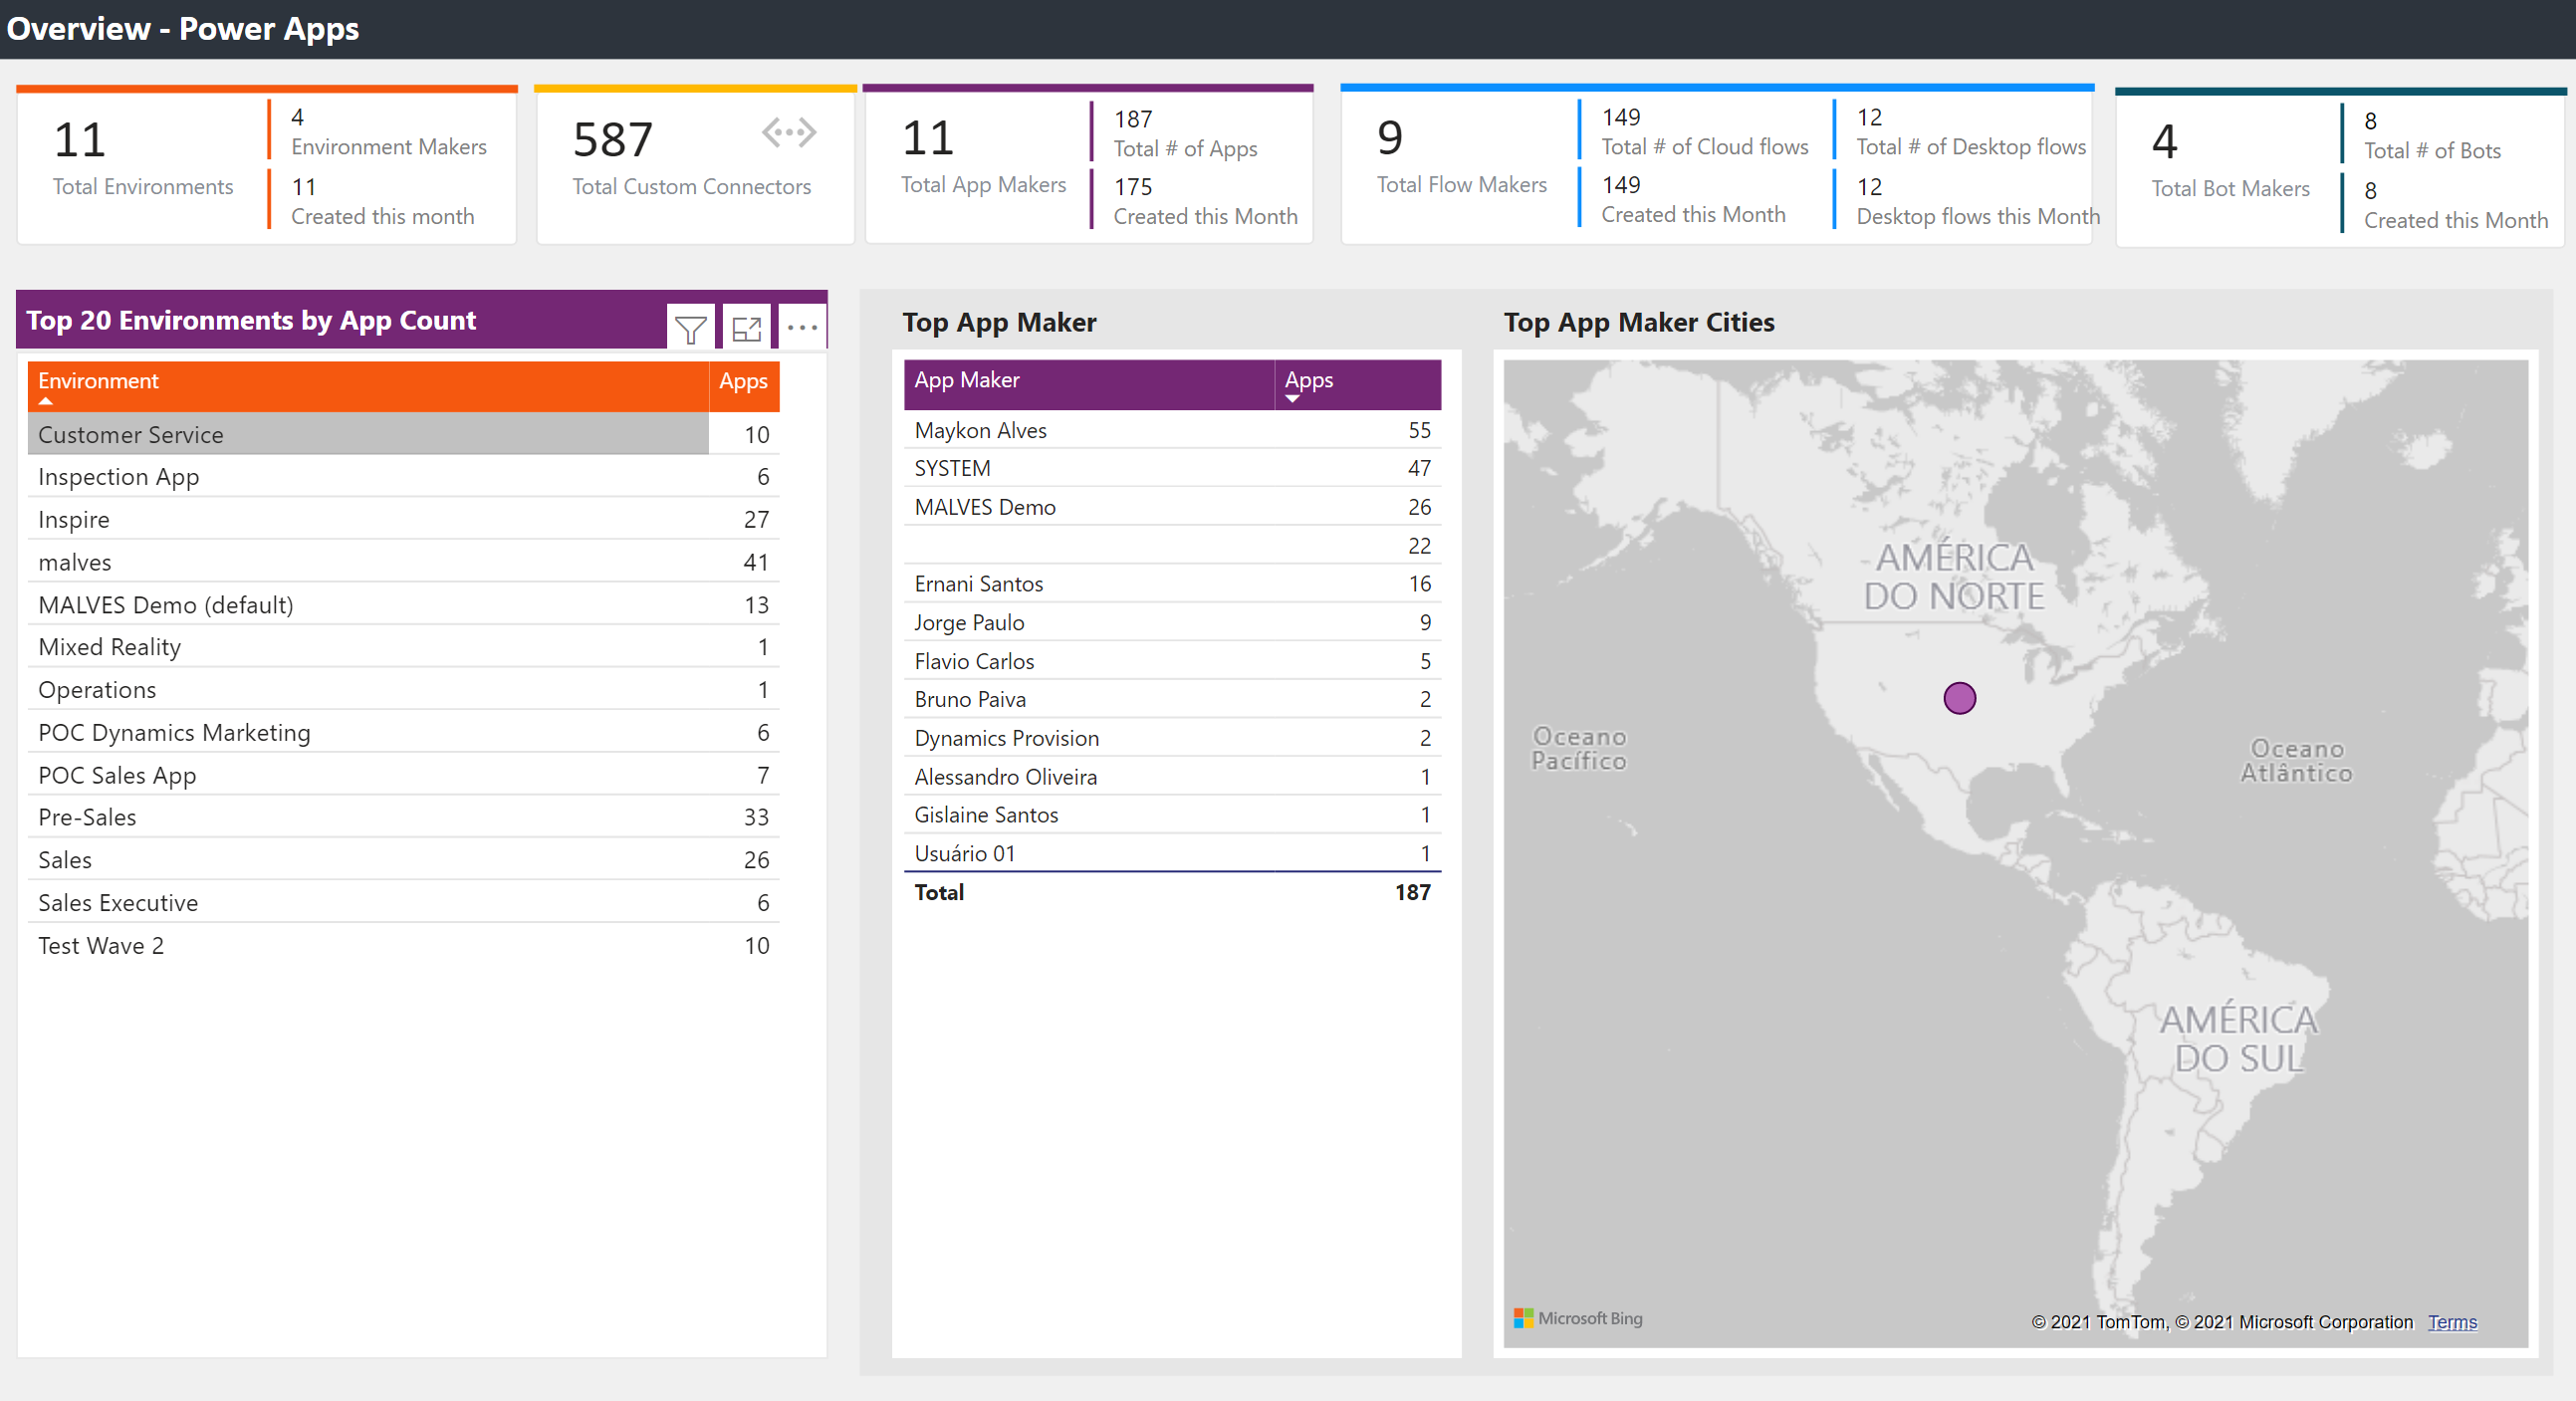
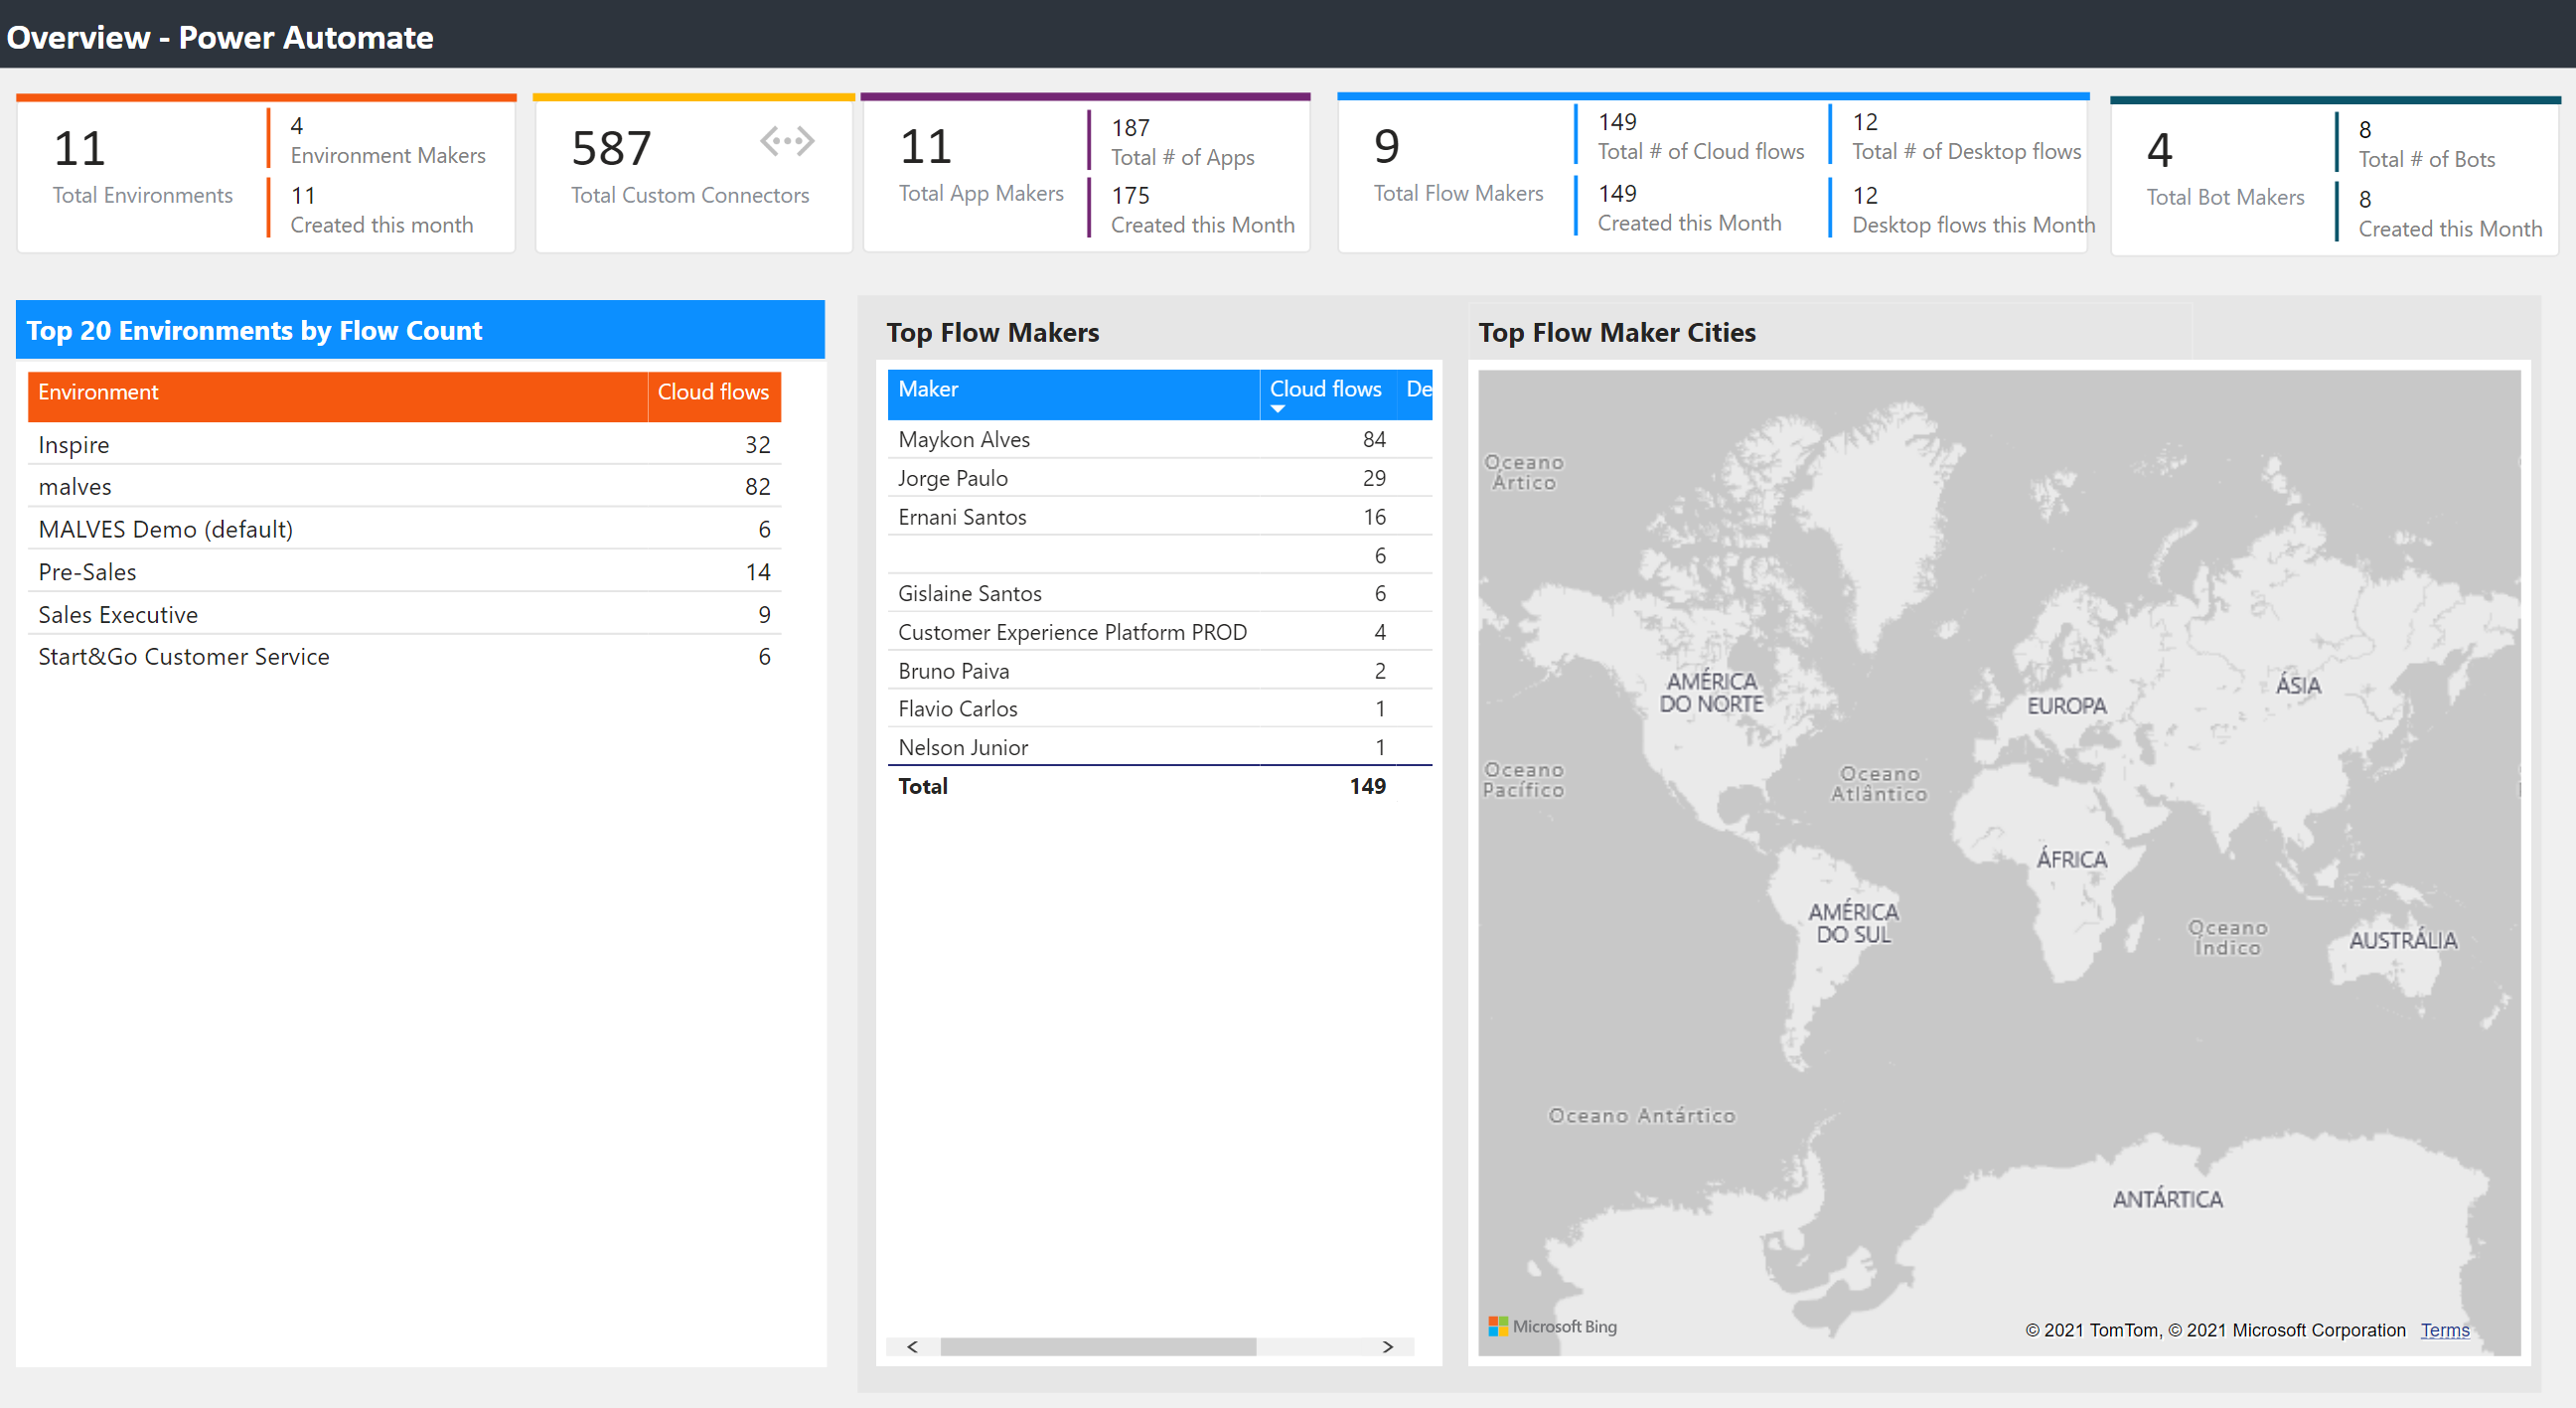
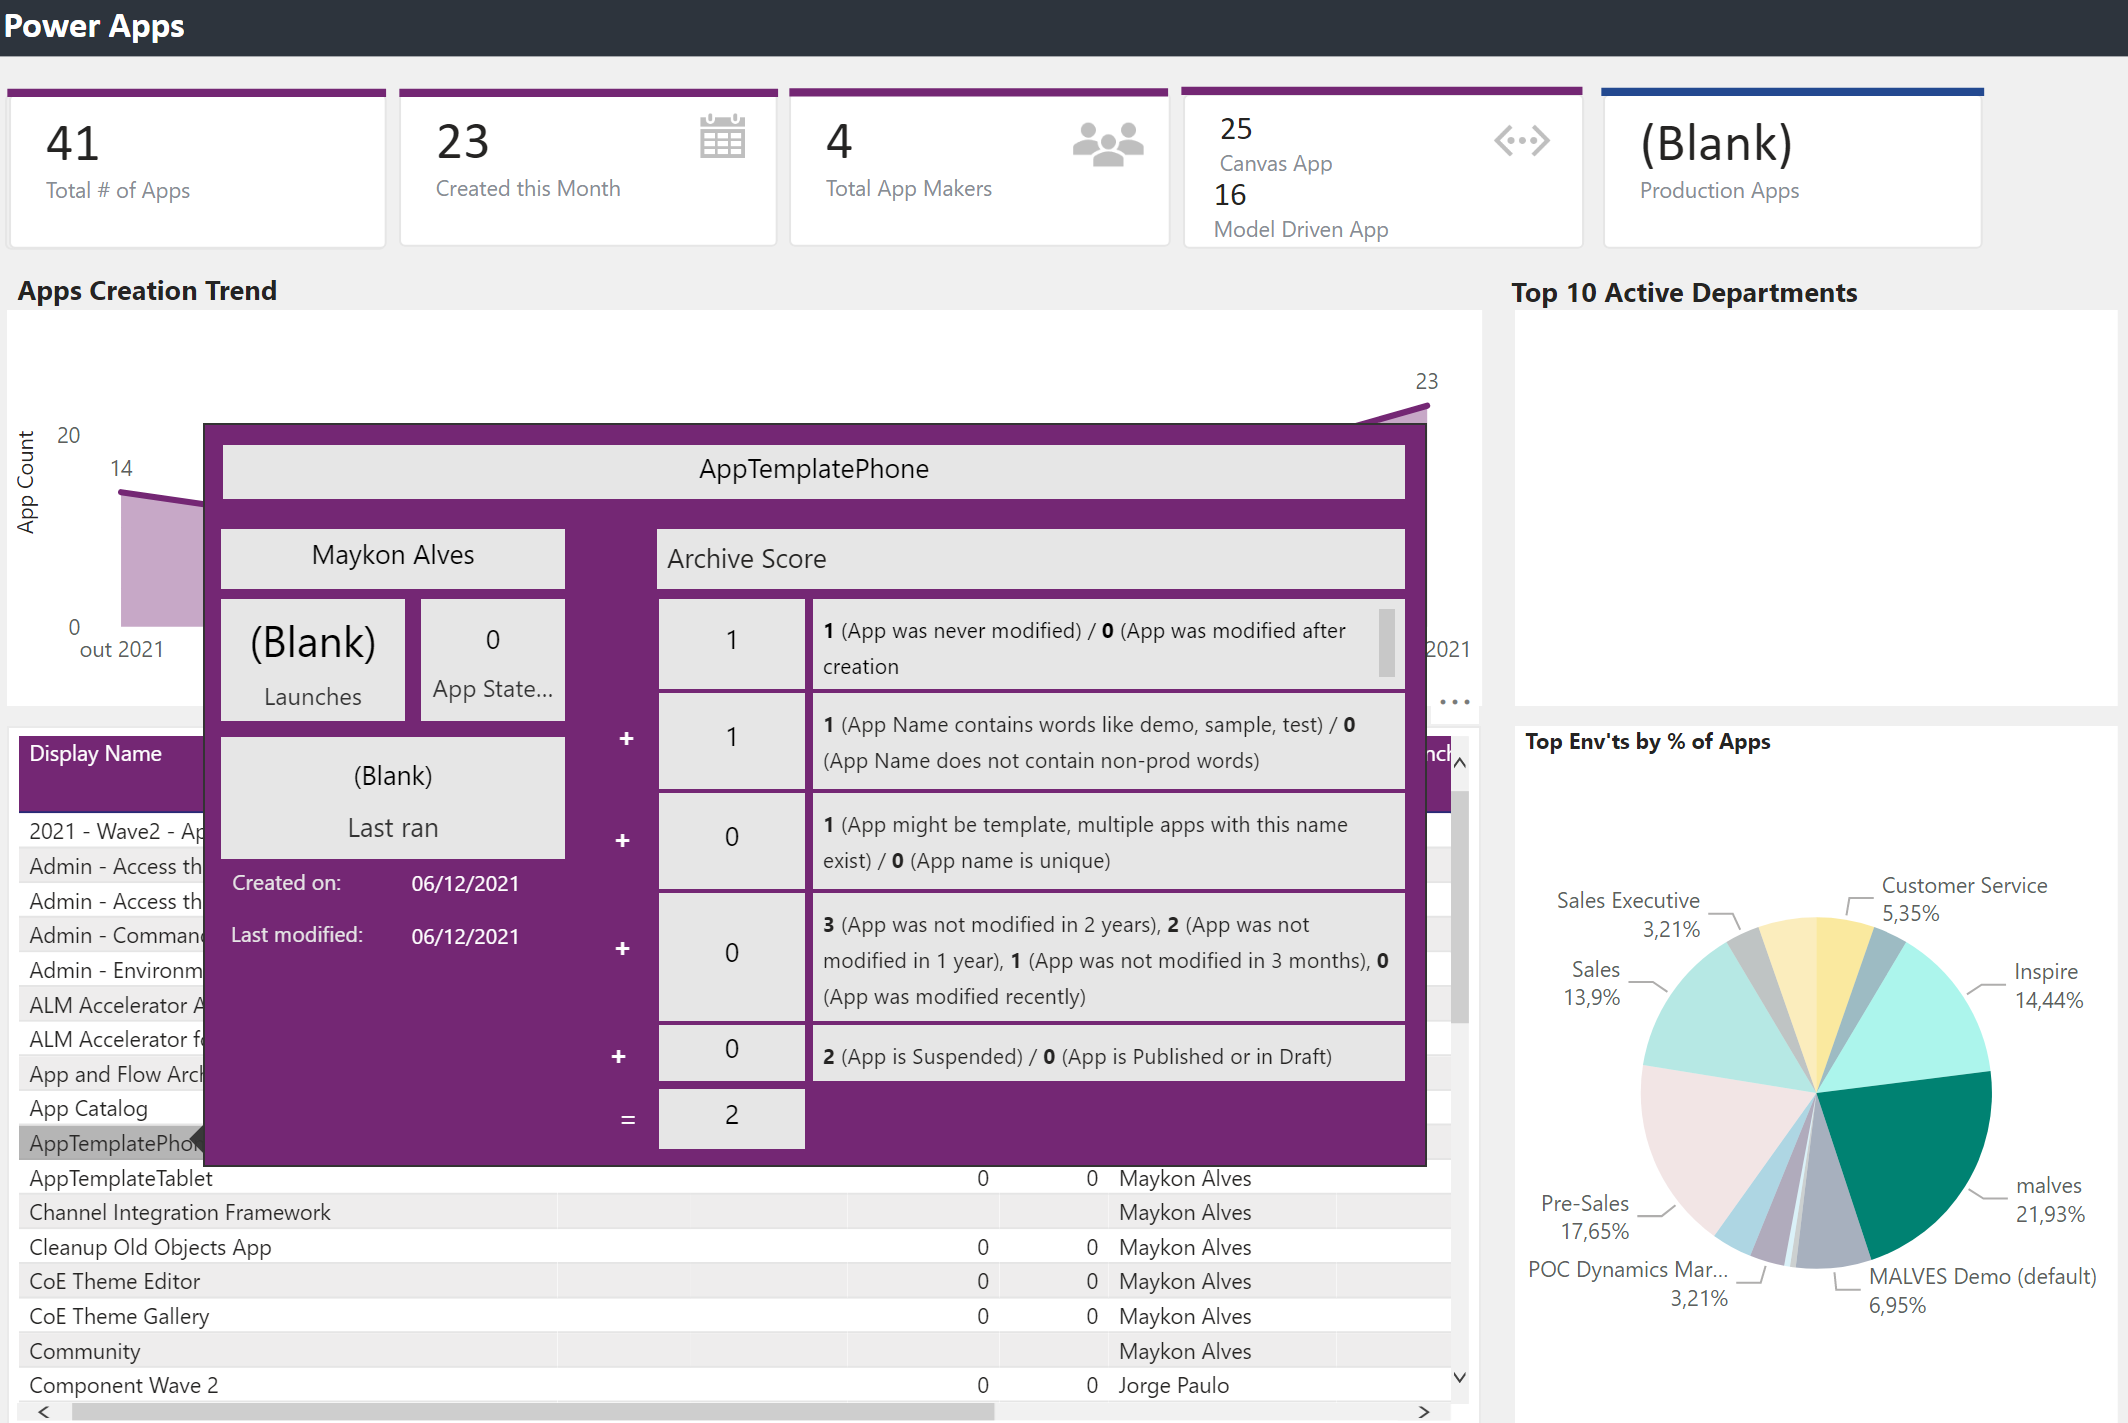
Apps and Cloud Flows
Another question answered: “How many Apps and Cloud Flows does the organization have?”. Here you can see it and much more.
Also, we have a Deep Dive section to the Apps and Cloud flows where you can analyze the usage and creation trends.
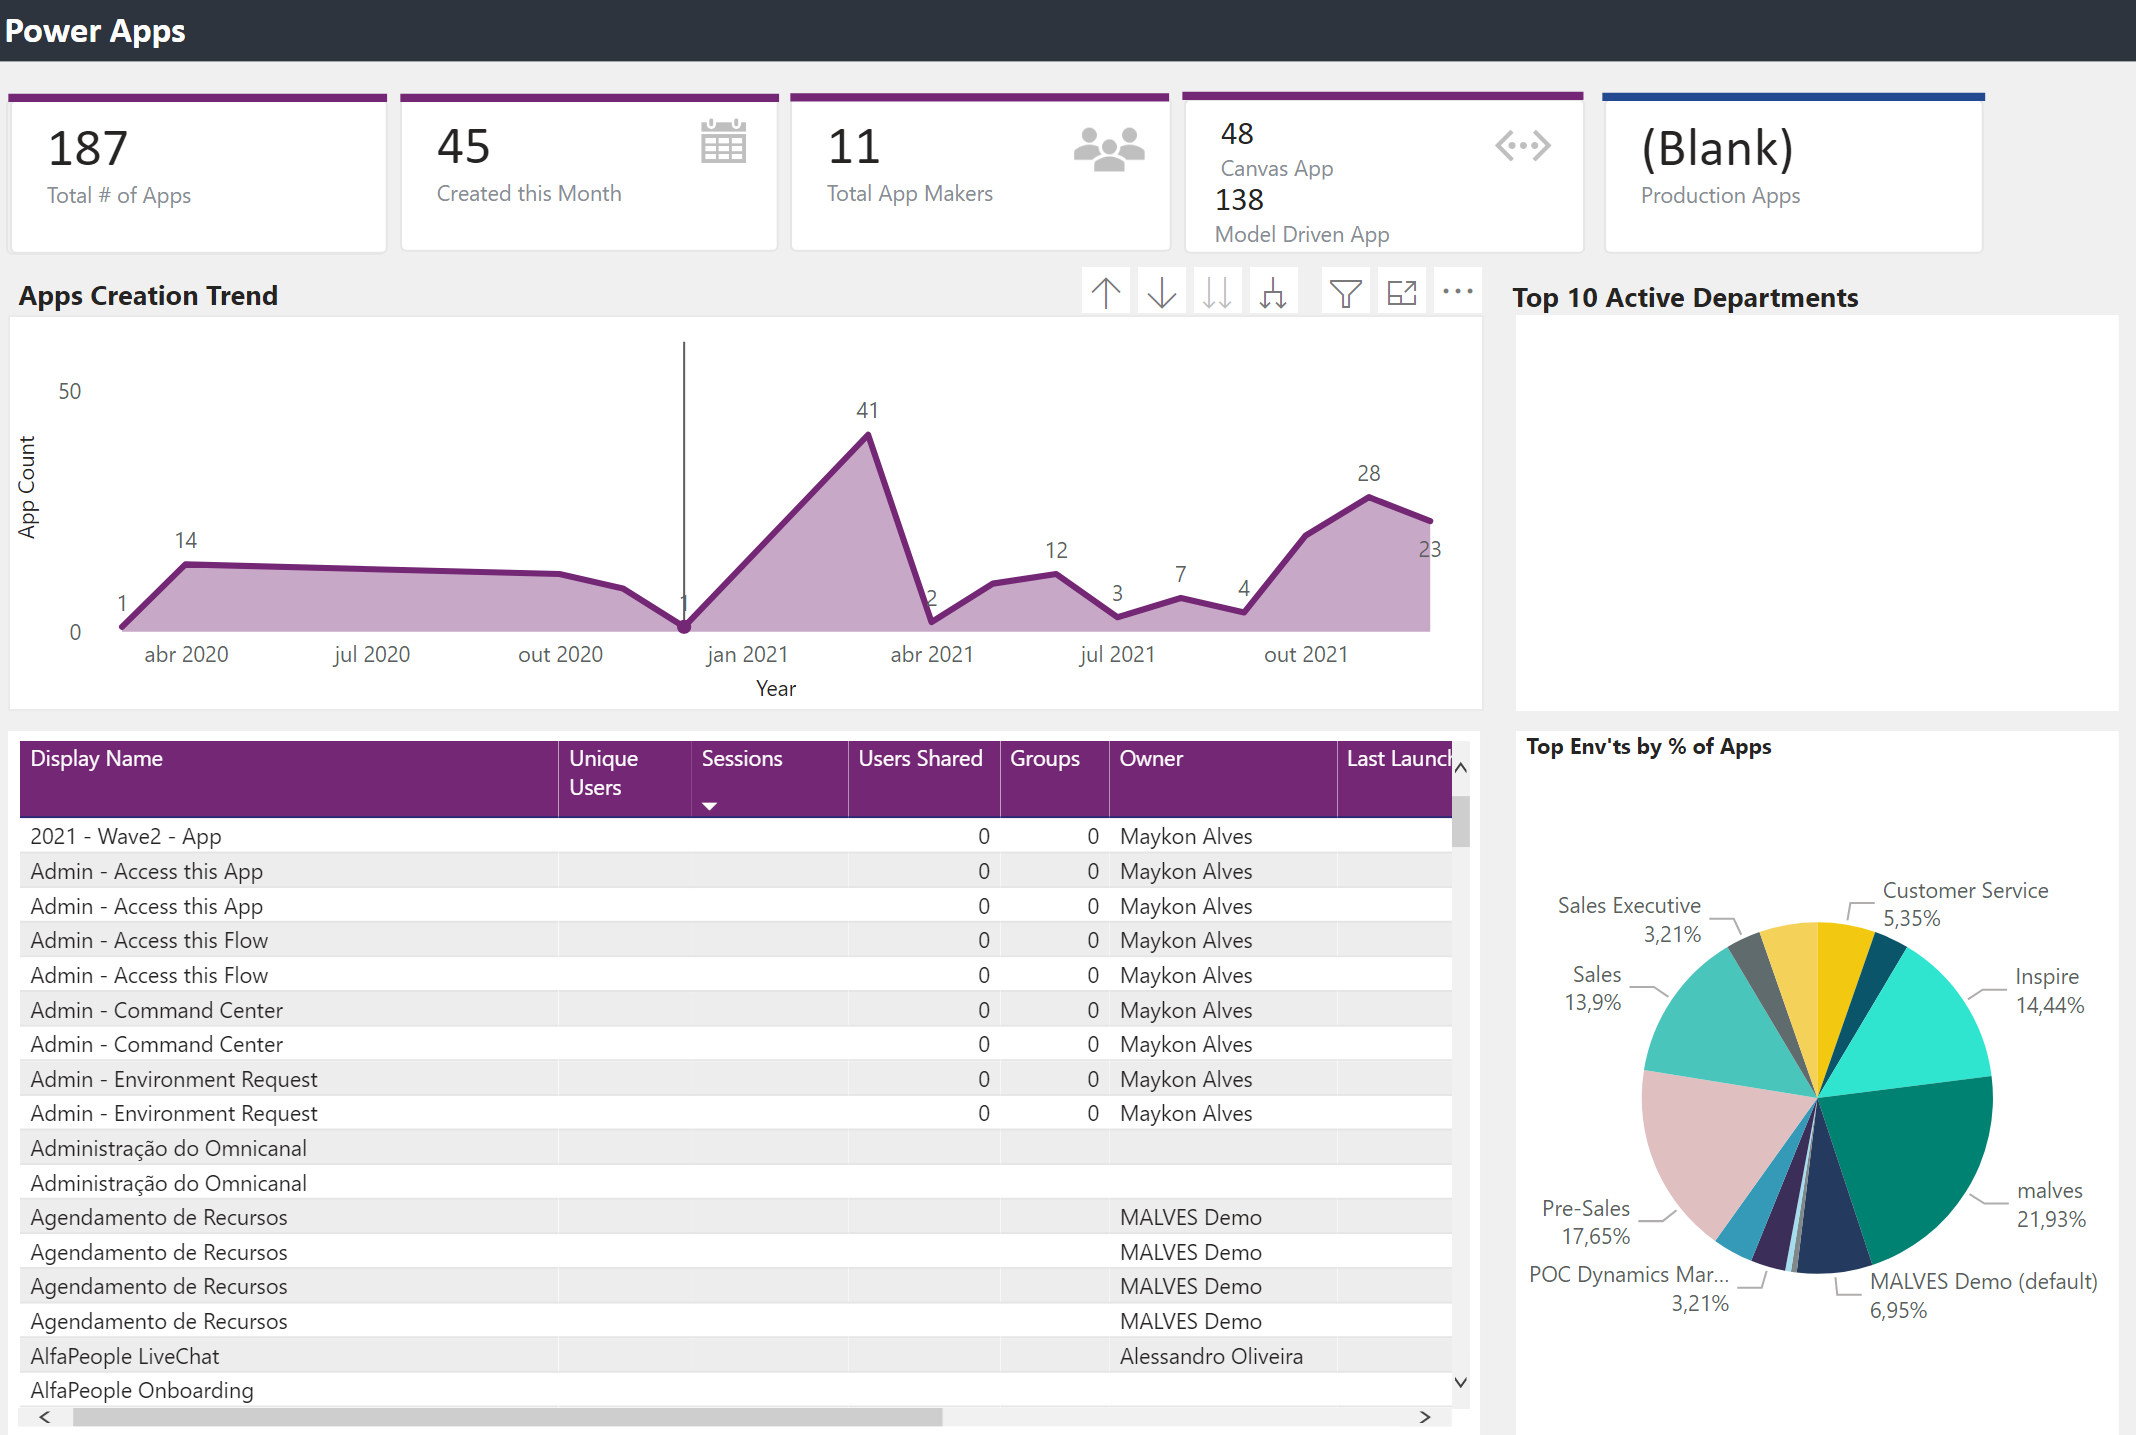

Still, the dashboard provides the Archive Score popup on the Deep Dive section, suggesting what Apps may be archived. Basically, the higher the score the more likely you can archive the resource.
Regarding the App, the highest possible score for an app is 6 – a score of 6 would represent an App that has not been modified since it was created, that is using non-production words like test or demo in the title, that has been created over three years ago and has likely been created from a template.
On Power Automate, the highest possible score for a flow is 7 – a score of 7 would represent a flow that has not been modified since it was created, that is using non-production words like test or demo in the title, that has been created over three years ago and has likely been created from a template, that is in stopped state and not complex (contains less than five actions).

It’s a great dashboard created on the Power BI. There are many other views which I strongly recommend you to check out.
Conclusion
As you can see, once installed the CoE kit, you already have an excellent overview of the organization. It will help in the planning of the next steps. So:
- Create a new organization and install the core components.
- Get an overall of the your tenant.
- Identify what is the organizations with high usage capacitiy.
- Be aware is there are components may be archived.
- Be aware of who are the Power Makers.
With all the data on your hands, you also will be prepared to start your work with the admin components.
I hope you enjoyed it. Next, let’s talk about the Admin components!
Stay tuned! 😉
Related links
- Center of Excellence Starter Kit – Overview – YouTube
- Microsoft Power Platform Center of Excellence Kit | Microsoft Docs
- CoE Starter kit Download package
- Understand the Core components – Power Platform | Microsoft Docs
- Set up core components – Power Platform | Microsoft Docs
- Set up the Power BI dashboard

Leave a comment